Glassnode: Speculative demand keeps Bitcoin under $68.7K
 Bitcoin has remained trapped in a tight trading band since early June, and on-chain data suggests the latest pressure is coming from short-term holders trying to exit around levels where they’re closest to breakeven. Glassnode’s latest weekly on-chain analysis points to realized-price “resistance” formed by speculative investors who bought within the past six months, while [...]
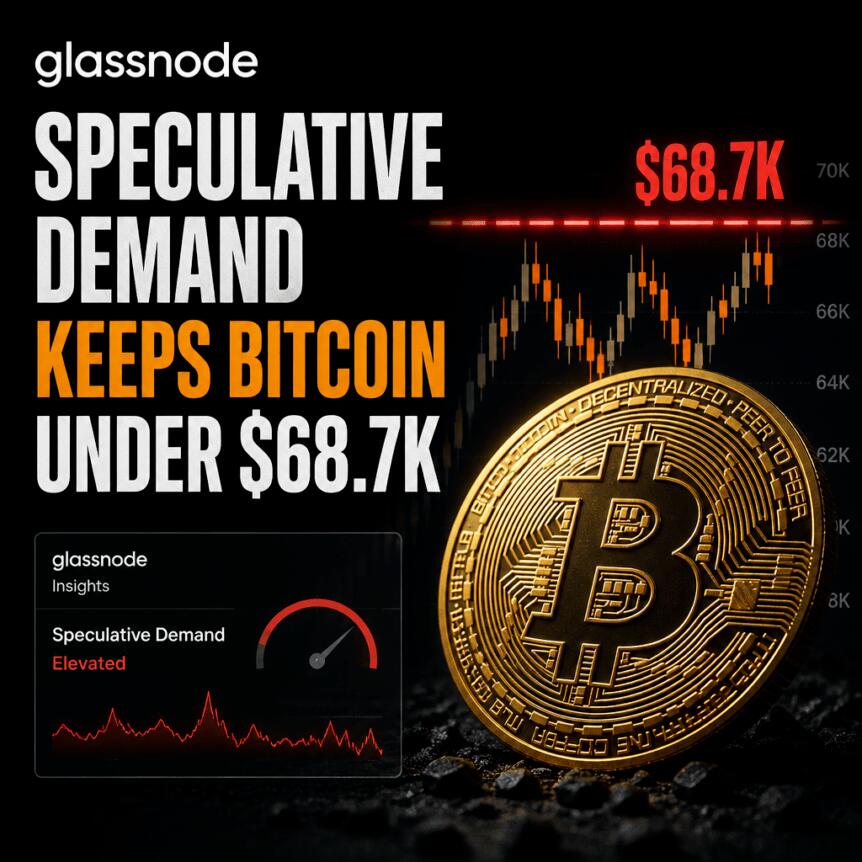
Bitcoin has remained trapped in a tight trading band since early June, and on-chain data suggests the latest pressure is coming from short-term holders trying to exit around levels where they’re closest to breakeven. Glassnode’s latest weekly on-chain analysis points to realized-price “resistance” formed by speculative investors who bought within the past six months, while Bitfinex Alpha highlights how a concentrated supply slice is repeatedly flipping between profit and loss as spot trades inside the range.
With BTC/USD stuck between roughly $58,000 and $68,000, the market appears to be working through a recurring pattern: rebounds are being met by holders looking to reduce exposure, even as long-term participants continue to absorb repeated tests from below. For traders, the key question is whether the speculative selling pressure can finally be exhausted—or whether the range simply persists.
Key takeaways
Glassnode estimates Bitcoin short-term holders are about 7.2% underwater overall, with an average realized cost basis near $68,700 acting as a notable resistance level.
Glassnode frames the “cost-basis ladder” as a structural reason price struggles to break out, citing the median realized price near $63,000 as a level that has absorbed repeated upward attempts for weeks.
Bitfinex Alpha says a large tranche of supply—1,794,308 BTC—currently sits in the $62,000 to $65,000 cost-basis band, reinforcing stubborn range boundaries.
As BTC trades within the same $3,000 band, the largest concentration of holders keeps moving between profit and loss, increasing turnover and reinforcing the range dynamic.
Why short-term holders are pushing back at range highs
In its latest weekly edition, Glassnode focused on the behavior of short-term holders (STHs)—investors who acquired BTC within the last six months. The firm reports that this cohort remains roughly 7.2% underwater in aggregate, based on its cost-basis measure (realized price). Glassnode places that realized cost basis at $68,700, a level it describes as central to why price is stalling around the upper part of the current range.
Glassnode also points to how realized-price “rungs” map into the market’s ongoing stalemate. The analytics firm notes that spot prices are sitting just above the median realized price (around $63,000), which it characterizes as the midpoint dividing coins’ cost bases into higher and lower halves. That same median level, according to Glassnode, has “absorbed every test from above for more than a month,” even as broader range conditions have persisted.
“The cost-basis ladder frames the stalemate. Spot sits just above the Median Realized Price at $63.0K, the level that splits every coin’s cost basis down the middle, and below the Short-Term Holder Cost Basis at $68.7K, the average entry of the market’s most recent buyers.”
“That cohort is underwater, which historically makes it quick to sell into recoveries, while the median level has absorbed every test from above for more than a month.”
In other words, the market’s upper breakout attempts are meeting sellers who are not yet fully “whole,” but who still have incentives to lighten exposure during recoveries—especially as they approach their average cost basis. This dynamic can slow or prevent sustained upside momentum, particularly when buyers and sellers are evenly matched across a narrow price corridor.
BTC/USD stuck in a June-to-present range
Glassnode’s analysis aligns with the broader price picture. BTC/USD has been boxed in a near three-month range between approximately $58,000 and $68,000 since the start of June. Cointelegraph previously described the ongoing tug-of-war inside this corridor, noting that technical factors have helped keep price contained.
A separate theme in current commentary is the idea that downside resolution may be increasingly likely in bear-market-style conditions. Cointelegraph cited a 50-month trend line near $65,800 as a factor contributing to tighter constraints in the trading range.
More recently, trader and analyst Rekt Capital warned that $63,000 appears to be weakening as local support, with each rebound from that level reportedly gaining less traction. While such technical commentary cannot determine direction on its own, it reinforces what Glassnode’s on-chain framing implies: repeated attempts to move upward may be repeatedly checked, while key levels near the middle of the range are not strengthening decisively.
Supply concentration in the $62,000–$65,000 band reinforces resistance
Beyond holder psychology, Bitfinex Alpha argued that the “stubborn” boundaries of the range are also tied to ownership distribution on-chain. In a Wednesday report, Bitfinex Alpha pointed to a distinct cost-basis concentration using the UTXO Realised Price Distribution (URPD) framework. According to Bitfinex Alpha, the $62,000 to $65,000 band holds 1,794,308 BTC at that cost basis—equivalent to 8.93% of circulating supply.
URPD tracks the price at which coins last moved on-chain, offering a way to visualize where large amounts of BTC are “anchored” by prior transaction activity. Bitfinex Alpha highlights that the largest holdings within this narrow band sit around $63,800.
“With price trading inside this band, the largest concentration of holders across any narrow $3,000 range keeps moving between profit and loss and a large volume of coins changes hands as a result,” Bitfinex added.
The implication for spot action is straightforward: when a large share of BTC is concentrated in a relatively tight realized-cost window, small price moves can shift many holders’ positions from paper gains to paper losses and back again. That can produce a market that repeatedly churns—active enough to avoid a clean bottom, but structured enough to limit breakouts.
What to watch next: the $68,700 and $69,400 thresholds
Glassnode’s analysis places the short-term holder realized cost basis near $68,700 as a key level for any upside attempt to clear. Meanwhile, Bitfinex Alpha notes that immediately above the current STH cost basis is a psychologically significant marker: Bitcoin’s old all-time high of $69,400 from November 2021.
For investors and active traders, the immediate watch is whether price can build momentum through the $68,700 area without quickly being met by STH-led supply. If it fails, the odds favor continued range behavior—particularly given how the $62,000–$65,000 cost-basis concentration encourages frequent position flipping. If BTC does manage to reclaim and hold above those thresholds, the market would need to demonstrate not just a rebound, but an ability to convert the speculative cohort’s behavior from selling pressure into net demand.
This article was originally published as Glassnode: Speculative demand keeps Bitcoin under $68.7K on Crypto Breaking News – your trusted source for crypto news, Bitcoin news, and blockchain updates.
About the Author


